A user types a sentence: "Track pricing and packaging changes across Pinecone, Weaviate, Qdrant, and ChromaDB." A few seconds later, they have a persistent monitor: a system that will search the web, crawl vendor pages, compare what it finds against what it found in prior runs, and stay quiet until something actually changes. The monitor runs on a schedule. It keeps running for weeks, months. It repairs itself when sources break.
This post explains what happens between that sentence and the running monitor. The answer involves a multi-phase AI planning pipeline, a custom JSON state-machine DSL on a distributed execution engine, URL-level set algebra, content hash comparison, a two-pass signal scoring system, and a self-healing loop that has processed over 11,000 automatic repair events in production. None of this is visible to the user. That is deliberate.
The pipeline has six stages. Each section of this post covers one:
- Planning: Turning natural language intent into an executable workflow spec
- Execution: Running the spec on a schedule via an event-driven state machine
- Change Detection: Comparing each run's results against the prior baseline
- Signal Scoring: Deciding whether the changes matter enough to notify
- Self-Healing: Repairing monitors that drift or break
- Chronicle: Compressing many runs into longitudinal memory
If you are interested in why perception requires different architecture than retrieval, that post covers the motivation. This post is the how.
From Plain English to Executable Spec
When a user creates a monitor, they provide a monitoring intent in natural language. That intent needs to become an executable workflow: a structured graph of searches, crawls, and data transformations that agents can run repeatedly.
We use a multi-phase LLM pipeline to make this translation. The pipeline runs five to seven phases, depending on the intent:

Discover extracts entities from the intent: company names, topics, keywords, and geographic scope. For "track pricing changes across Pinecone, Weaviate, Qdrant, and ChromaDB," it identifies four company entities and the monitoring topic (pricing/packaging).
Classify and Enrich run concurrently. Classify categorizes the intent type (competitive analysis, regulatory tracking, event detection). Enrich calls the search API to research the entities, understanding what pages exist, what domains are relevant, what sources are likely to carry the signal. These two phases run in parallel because they have no dependency on each other. We landed on this design after measuring that sequential execution added 4-8 seconds of unnecessary latency.
Verify checks whether the enrichment phase gathered enough context. If a key entity returned zero results, maybe because the company name is ambiguous or newly founded, verify triggers a follow-up search with a refined query. This phase is fail-open: if the verification call fails, planning continues with whatever enrichment succeeded.
Generate takes all prior context and produces an executable workflow spec. The output is a JSON state machine. We will come back to what that looks like.
Each phase checkpoints its status to the database. If the pipeline fails at phase 4, it does not restart from phase 1. If the LLM call in the generate phase times out, we know exactly where it stopped and what context was available. This is important because planning is the most expensive step in monitor creation. It consumes credits for the enrichment searches, and we do not want users paying twice for a transient failure.
What the Spec Looks Like
The workflow spec is a custom JSON state-machine DSL. Our requirements were specific: a minimalist declarative spec that LLMs can author from natural-language intent; durable, distributed execution on our own infrastructure; native task types for web data, with failure semantics tuned to crawl's non-zero error rate; first-class versioning; and a write-many/run-many design supporting thousands of concurrent monitors per customer. No off-the-shelf option met all of these.
A simplified spec for the vector database pricing monitor looks roughly like this:
{
  "start_at": "search-vendors",
  "states": {
    "search-vendors": {
      "type": "Parallel",
      "branches": [
        {
          "start_at": "pinecone-search",
          "states": {
            "pinecone-search": {
              "type": "Task",
              "task_type": "search",
              "arguments": {
                "query": "Pinecone pricing plans tiers 2026"
              },
              "end": true
            }
          }
        }
      ],
      "next": "crawl-pricing-pages"
    },
    "crawl-pricing-pages": {
      "type": "Map",
      "items": "{% $input.results[0..4].url %}",
      "iterator": { ... },
      "end": true
    }
  }
}
The spec supports four state types: Task (execute a search or crawl), Pass (transform data with no side effects), Parallel (fan out to N statically defined branches, wait for all), and Map (fan out to N dynamically defined branches, wait for all). JSONata expressions, wrapped in {% ... %}, handle data flow between states, extracting URLs from search results, filtering arrays, and transforming outputs.
Why a state machine? A monitor's workflow is inherently a graph of search, crawl, and transform operations with parallel fan-out. We adopted state-machine structure because it maps cleanly to this shape. Every step has a typed state, explicit transitions, and a well-defined contract. The orchestrator always knows what state it is in, what the valid next states are, and how to resume after an interruption.
The planning pipeline generates this spec from intent alone. The user never sees it. They see a monitor with a description, a cadence, and a feed of results. The spec is the executable machinery underneath.
How the Monitor Runs
The planning pipeline produces the spec once, when the monitor is created. From here, execution takes over. Every time the monitor's schedule fires, the orchestrator loads the spec and walks the state graph.
The workflow engine is an event-driven state machine. It does not hold a long-running process for each monitor. Instead, it processes three message types from a single SQS queue:
- Resume: Start a new execution, or pick up orchestration from the current state.
- Job Completed: An external task (search or crawl) finished.
- Step: Run a Parallel or Map branch, or check whether its siblings are done.
When a monitor's schedule fires, a Resume message is enqueued. The orchestrator loads the workflow spec, compiles it to an intermediate representation, and begins walking the state graph.
For a Task state, the orchestrator dispatches the operation (search or crawl) to our control plane API. If the API returns 202 (async), the orchestrator marks the step as waiting_external and stops. There is no thread blocked waiting. When the async job completes, the worker sends a Job Completed message back. The orchestrator picks up where it left off.
For a Parallel state, the orchestrator creates a parent step and enqueues child messages, one per branch, up to the configured max concurrency. Each branch runs independently. When all branches complete, a join check collects their outputs and continues to the next state.
This design was not our first approach. The original system ran searches inline. A single process would execute the entire workflow synchronously. That worked for simple monitors with one search query. It broke when we added multi-step workflows with parallel branches. A monitor tracking five vendors in parallel would hold a single process for 30-60 seconds while all five searches completed. Under load, the system ran out of worker capacity because each execution monopolized a process.
The event-driven approach means an orchestration worker processes a step in milliseconds (dispatch the task, record the state, return), and the execution can span minutes without tying up resources. A monitor with a Parallel state containing five branches generates five independent messages that can be processed by different workers.
When Things Break: Soft-Complete vs. Hard-Fail
External operations fail. Search APIs time out. Crawled sites block our requests. URLs return 404. The question is: should a single failed crawl kill the entire run?
We split failures into two categories.
Expected failures are the kind that happen routinely on the open web. They soft-complete. The step is marked completed (not failed), its output carries the error context, and the workflow continues to the next state. Expected failures include: timeout, rate_limited, site_unreachable, site_blocked, and provider_error.
Unexpected failures indicate a platform bug. They hard-fail the entire run. The orchestrator cascades the failure, skips remaining steps, and records the error. Unexpected failures include internal_error.
This distinction matters for monitoring quality. If a monitor tracks five competitors and one vendor's pricing page returns a 403, the other four vendors' data is still valuable. Killing the run would discard good data because of one blocked crawl. Soft-completing the failed step lets the remaining branches contribute to the summary.
The failure classification is an explicit allowlist: new failure categories default to unexpected (fail the run) unless added to the expected set. We chose this safe default because a new, unclassified error is more likely to indicate something we did not anticipate than something the web routinely does.
What Happens After a Run Completes
The execution engine handles getting the work done. But a completed run is not yet a signal. That requires comparing what the monitor found against what it found in prior runs.
A completed run produces a canonical manifest: a structured record of every search query issued, every page crawled, and every extraction attempted. The manifest is the input to the postprocessing pipeline, which determines whether the run found anything worth telling the user about.
URL-Level Change Detection
The core operation is set algebra on the URL manifest, computing net_new, dropped, and retained URL sets between the current run and the previous one. The implementation detail that matters is normalization: URLs are canonicalized before comparison (query parameters sorted, fragments stripped, trailing slashes standardized) so that example.com/page?a=1&b=2 and example.com/page?b=2&a=1 are recognized as the same page.
The first execution has no previous run to compare against. Everything is net-new, change rate is 100%. This baseline run establishes the reference point for all future comparisons.
Content Hash Comparison
URL-level diffs miss a critical case: a retained URL whose content changed. A company updates its pricing page (same URL, different data).
We hash crawled content with SHA-256 and compare hashes across runs for retained URLs. When hashes diverge, our delta detection prompt receives the before/after content as evidence.
We added content hashing in April 2026 after a regulatory filing monitor missed an in-place update. A pharmaceutical company had updated a clinical trial status page (same URL, new data), and the monitor scored it as a no-change run because the URL set was identical.
Finding Classification
The postprocessing LLM classifies each finding from the run:
| Classification | Meaning |
|---|---|
| NEW | Recent, relevant to the monitoring intent |
| UPDATE | Change to a previously reported finding |
| CONTEXT | Background information or off-intent content |
The classification system went through a significant redesign. Initially, off-intent results were classified as IRRELEVANT and removed entirely. The problem: the summary would say "nothing happened" even when real web changes existed. They just were not relevant to the intent. Users saw an empty summary, lost trust, and could not inspect what the system had actually found.
We changed the approach. Off-intent findings are downgraded to CONTEXT instead of deleted. The signal score still caps appropriately (no-change ceiling), so the user is not spammed. But the historical record preserves what was checked and why it was classified as off-topic.
Signal Scoring
The final step is deciding whether the run deserves a notification. We use a two-pass scoring system, combining a deterministic heuristic (V1) with an LLM-as-judge that has deterministic guards (V2), described in detail in Most Runs Should Be Quiet. The short version: over a recent 30-day window, 75% of notifications were suppressed. The median signal score across 9,000+ runs was 7 out of 100.

Self-Healing: When Monitors Drift
Change detection and scoring handle the output of a single run. But what happens when the monitor itself is the problem, not the results, but the workflow that produced them?
A scoring system tells you whether a run was worth escalating. But what happens when the monitor itself is broken, searching for the wrong things, crawling blocked pages, producing chronic noise?
After every run is scored, the result is published to a fan-out topic. The auto-healing worker consumes each scored run and evaluates whether the monitor's workflow spec needs repair.
The trigger logic is conservative. A single quiet run is normal; most runs should be quiet. The system intervenes when evidence accumulates:
- Quality below 40: The run's helpfulness score (a composite of coverage, relevance, and accuracy) dropped too low.
- Trustworthiness failure: The LLM summary contradicted the source evidence.
- 3+ consecutive runs with signal < 10: Chronic low signal indicates a structural problem; the monitor is looking in the wrong places.
- Weak source authority: Claims rely on social media reposts rather than official sources.
When the trigger fires, the system composes an edit description: a one-shot LLM call that reviews the run evidence (search queries, crawl failures, quality issues) and proposes a concrete fix. The edit is then applied by a separate worker that generates a new workflow spec version, validates it, and promotes it atomically.

The most important design choice was effectiveness tracking. Every automatic edit records the helpfulness score before and after. If a previous edit regressed quality, the next healing attempt sees that history and is instructed to try a fundamentally different approach or do nothing. This prevents oscillation between two bad strategies.
In production, the auto-healing system has processed over 11,000 events with a 98.1% success rate. One vendor alone triggered six automatic adaptations. The original crawl was blocked, so the system switched to search, then to a different crawl target, then followed a page migration. Each time, the system found a new path to the same information.

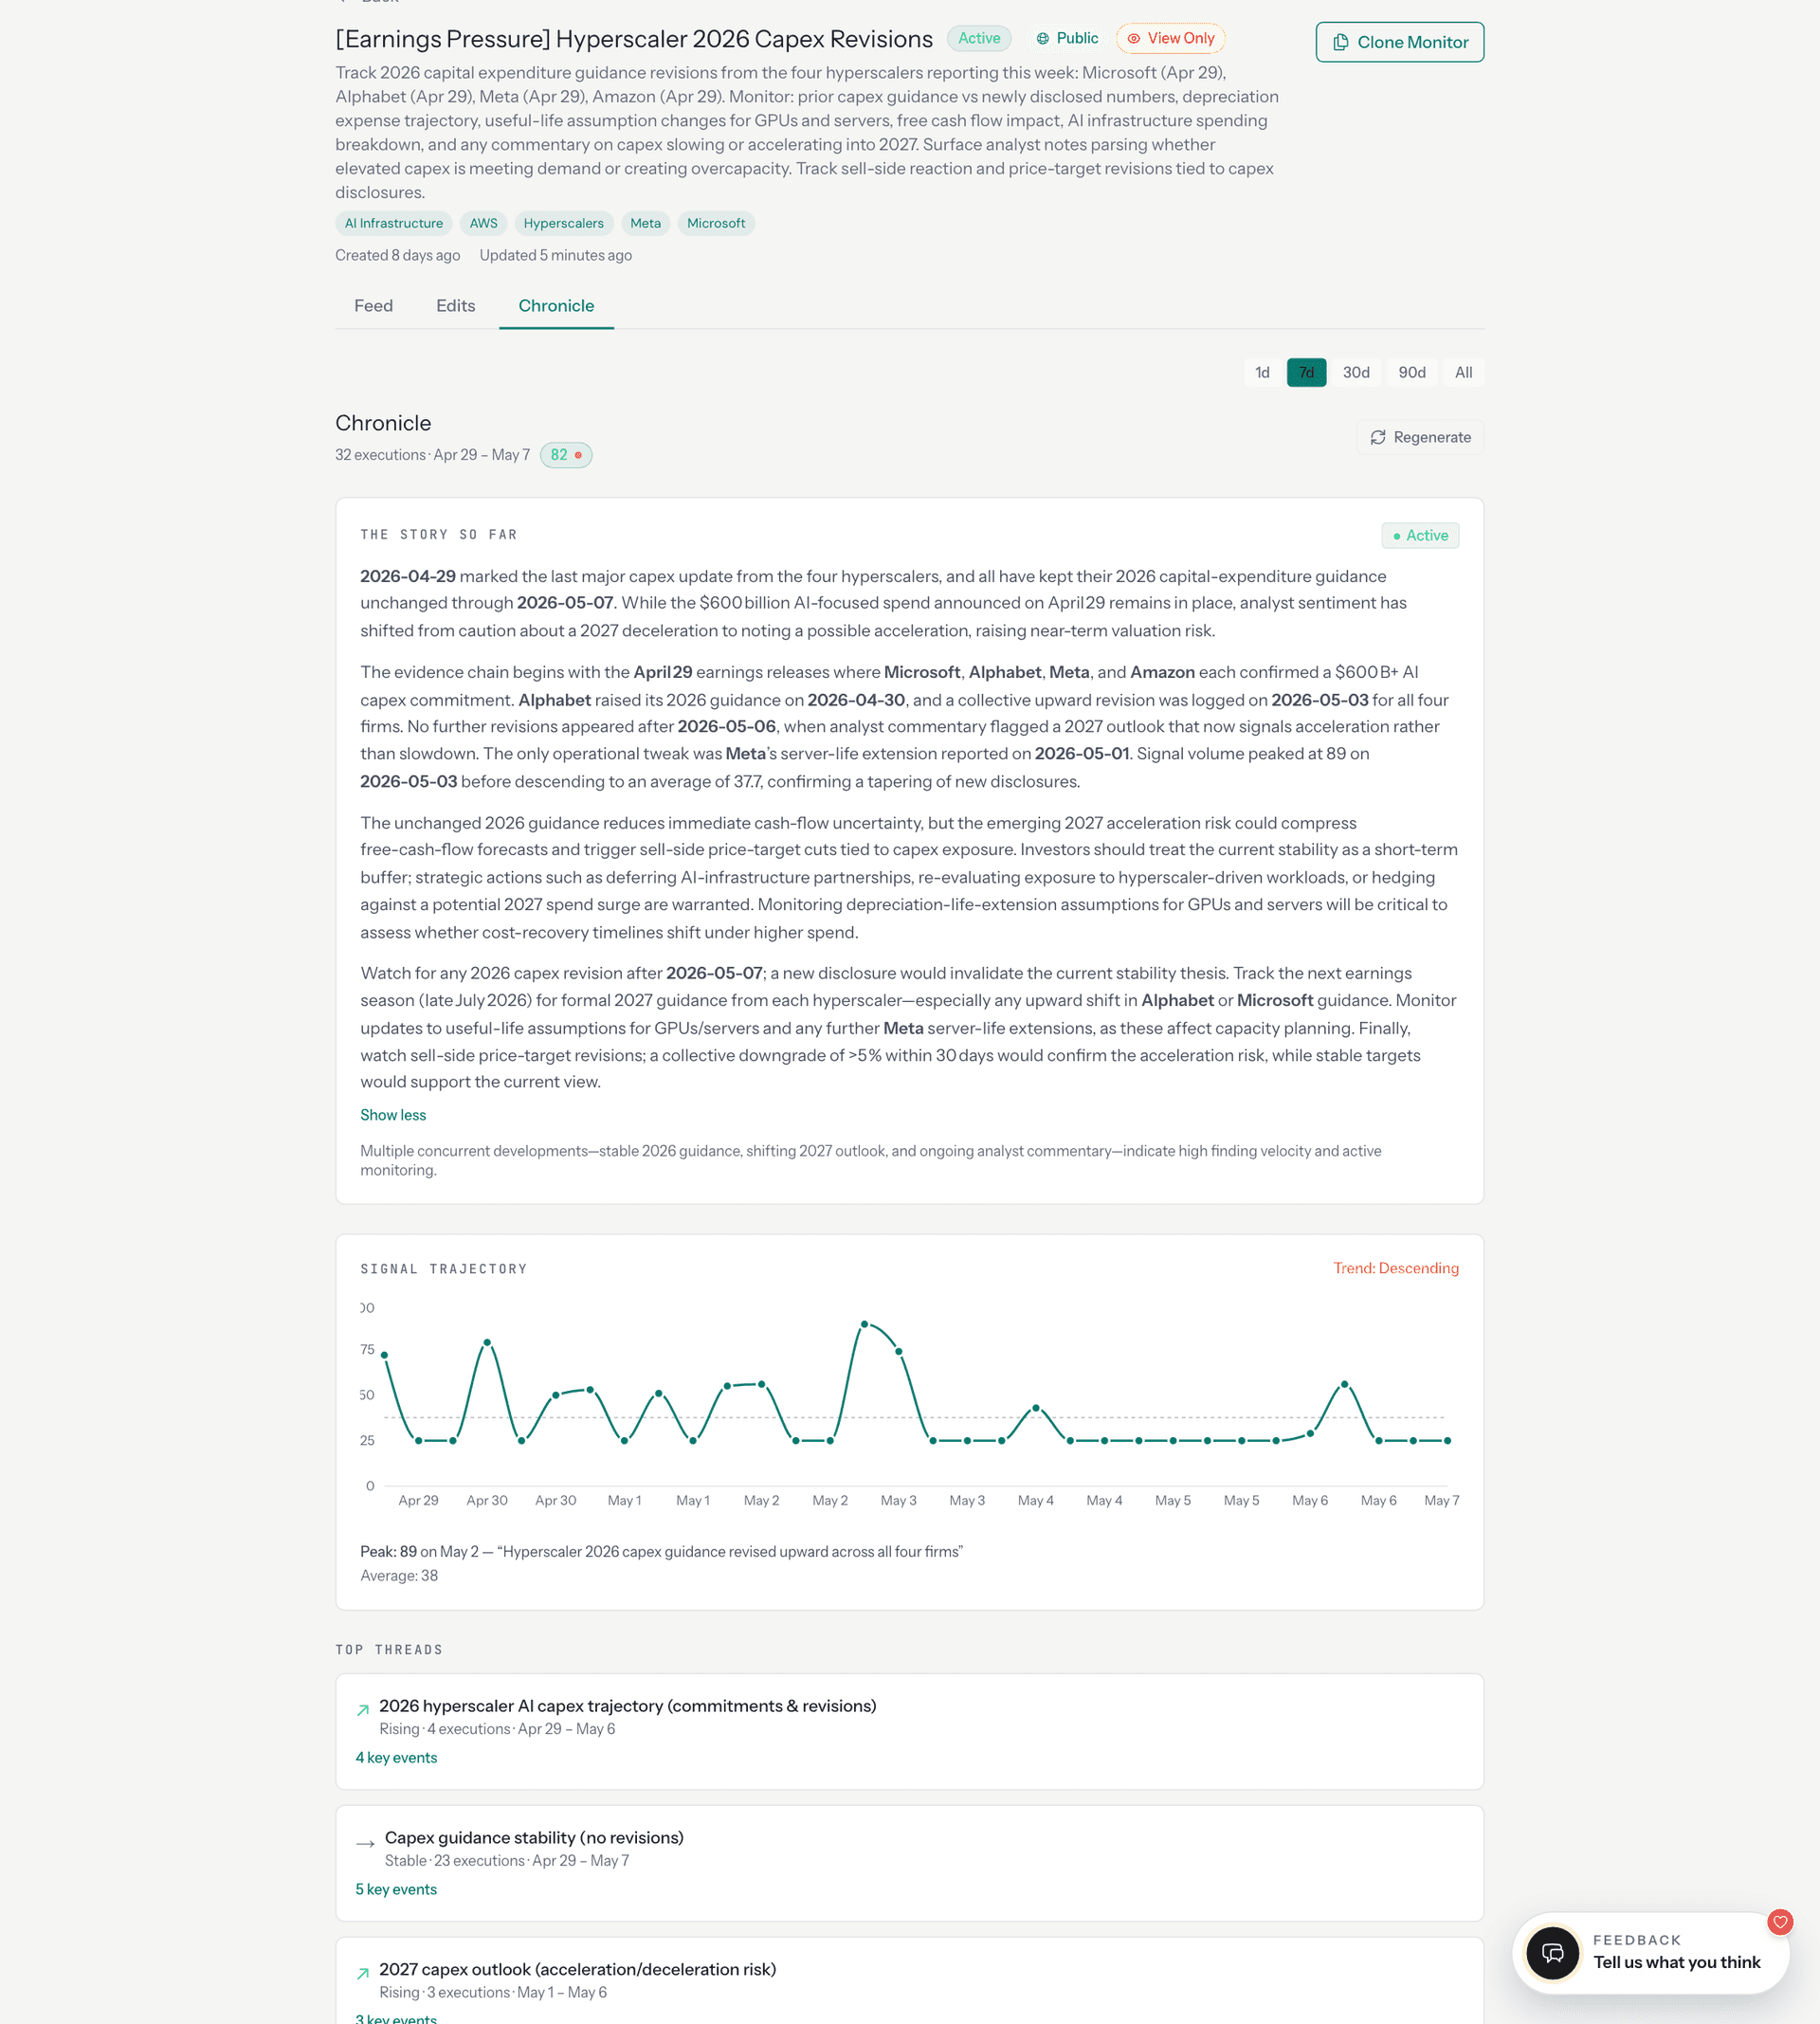
Chronicle: When Runs Become Memory
Self-healing keeps individual monitors healthy. But when a monitor has been running for weeks, something more valuable than any single run emerges.
A single alert tells you what changed today. But when a monitor has been running for weeks, you often want the bigger picture: the story that emerges across many runs.
Chronicle compresses dozens of monitor runs into a single narrative. It works in two phases.
Phase 1 is deterministic extraction. For each entity the monitor tracks, Chronicle builds a longitudinal view: when the entity first appeared, when it was last mentioned, how many runs referenced it, and whether its trajectory is rising, stable, or fading. Findings are deduplicated across runs using fuzzy content hashing (normalize the text, sort words, SHA-256) so that the same announcement reported by different sources in different runs appears once with an observation count.
Phase 2 is LLM synthesis. The deterministic extraction feeds a prompt that clusters findings into topic threads and writes a narrative arc covering what shifted, what held, and what is emerging.
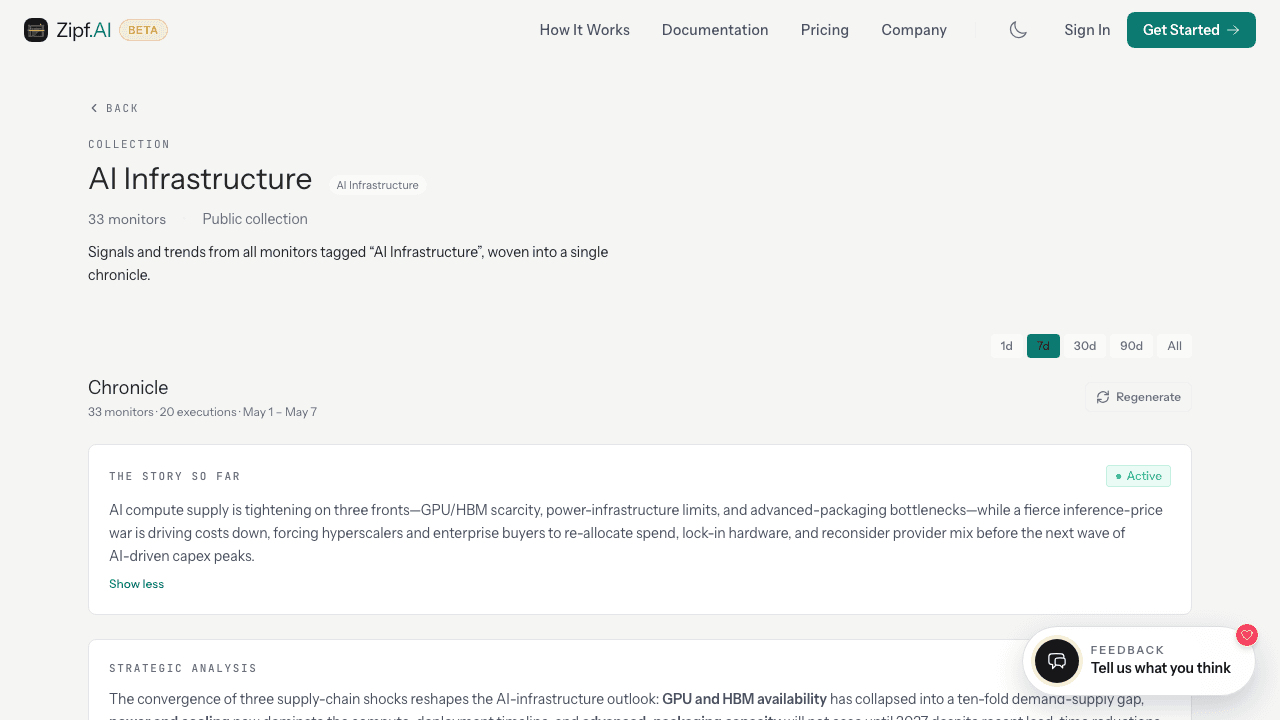
Collections extend chronicle to groups of related monitors. Thirty-three monitors tagged "AI Infrastructure," covering hyperscaler capex, custom silicon, GPU allocation, and concentration risk, are woven into a shared chronicle that surfaces cross-monitor patterns no single monitor could see.
What the User Sees
Everything described above (the planning pipeline, the state machine, the set algebra, the content hashing, the signal scoring, the auto-healing loop, the chronicle extraction) is invisible to the user by default.
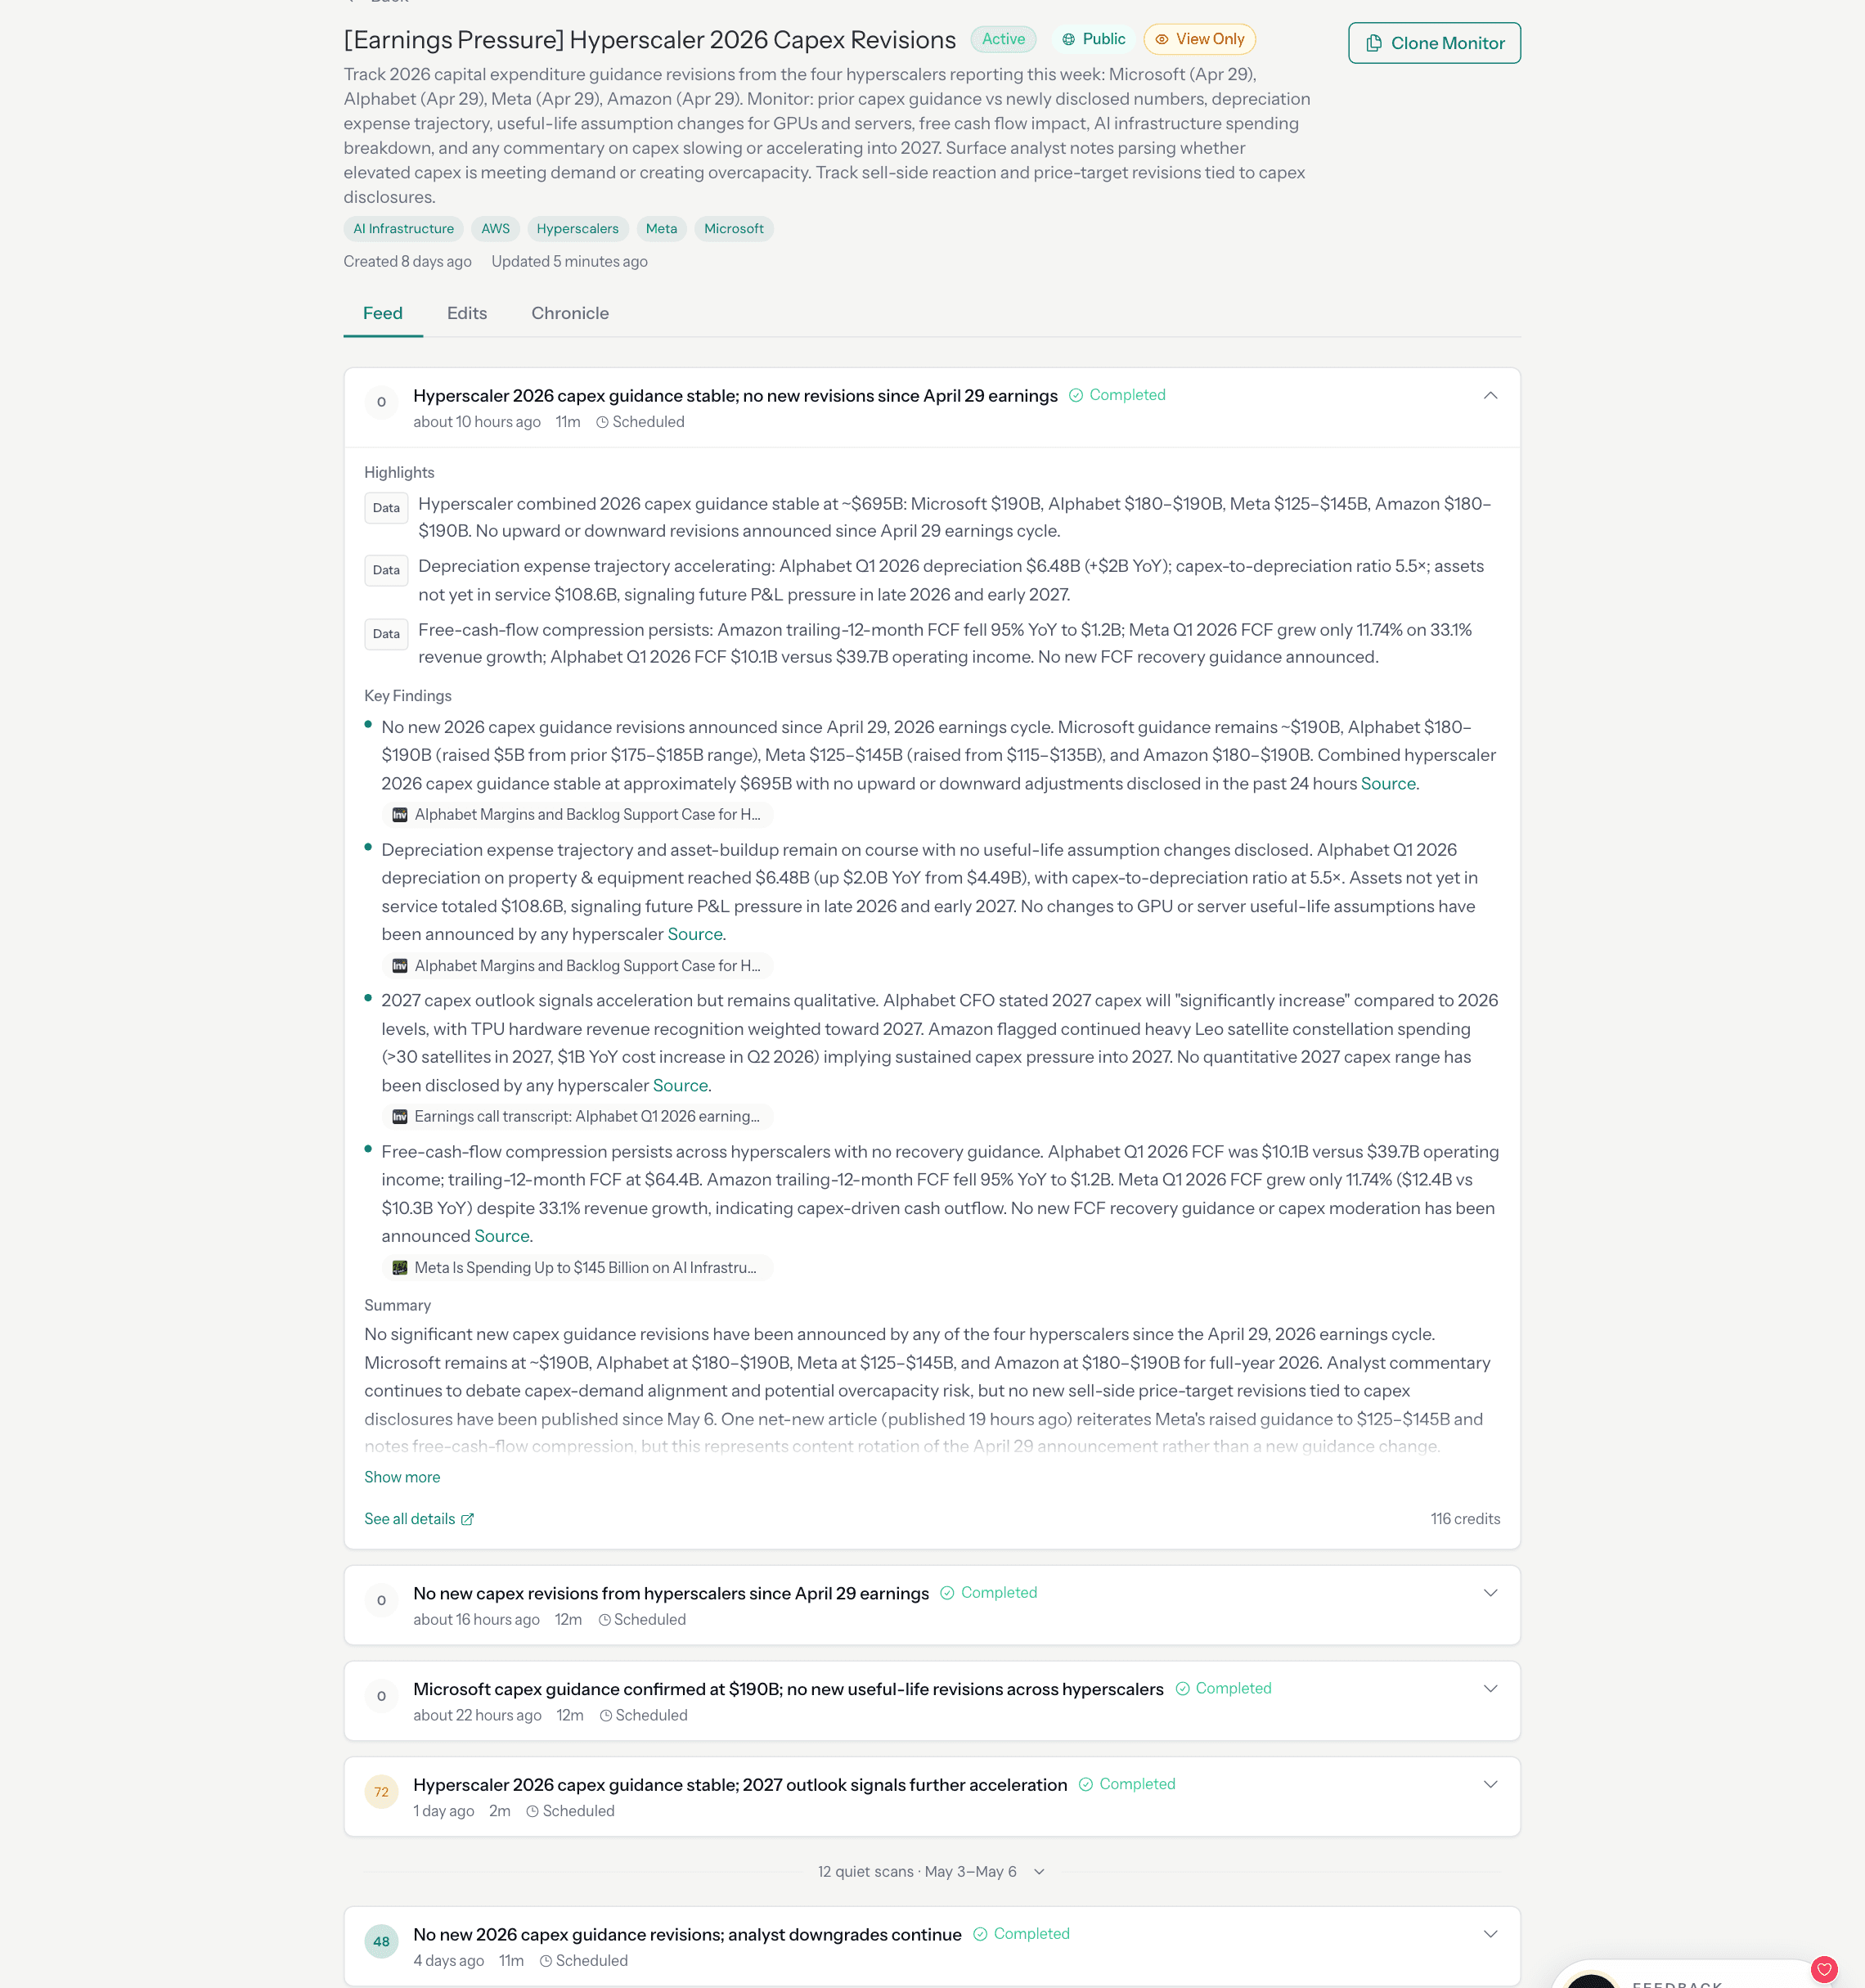
The user sees a feed:
The quiet runs are not failures. They are evidence that the system checked, compared against the baseline, classified the findings, scored the result, and determined (with the full machinery described in this post) that nothing crossed the threshold.
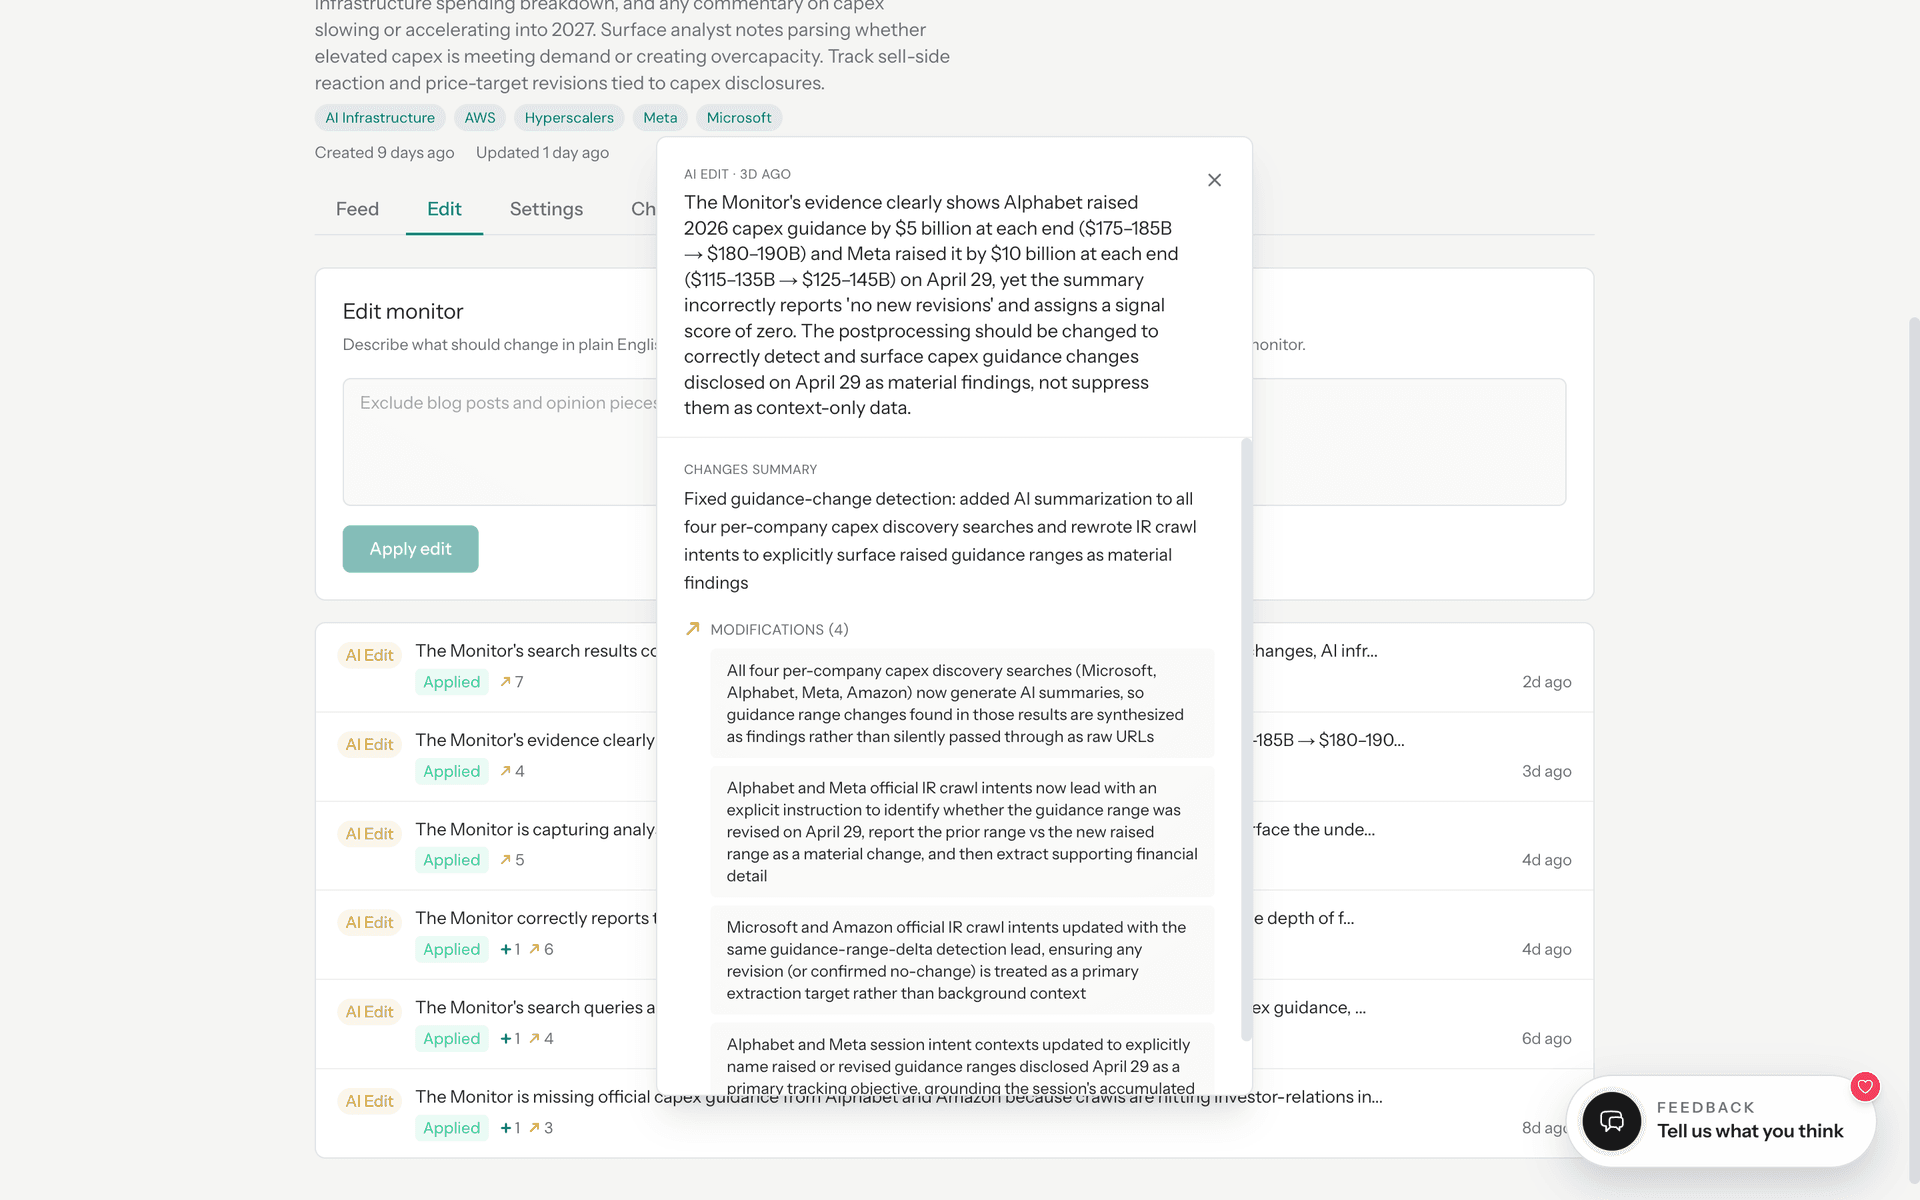
If the user wants to see how the monitor has adapted over time, they can inspect the edits surface:
If they want the longitudinal view, chronicle is there. If they want the raw sources, every finding links to the page it was extracted from.
The design principle is progressive disclosure. A first-time user should understand what their monitor is doing without understanding any of the architecture. A power user who wants to inspect the machinery can drill into any layer.
A Monitor Is Not an Alert
The most useful mental model is this: a monitor is a standing question about the live world, backed by a durable system with memory, judgment, and self-repair.
You define what to watch once. The system plans the workflow. The orchestrator runs it on a schedule. Change detection compares against the baseline. Signal scoring decides whether the change matters. Auto-healing repairs the monitor when sources break. Chronicle compresses the history into narrative.
Most runs are quiet. That is the system working as designed, checking, comparing, scoring, and deciding that nothing was worth your attention.
The engineering is not in generating alerts. It is in making sure that when the system stays quiet, the silence is earned.
Cite this post
@online{campos2026monitor,
  author    = {Daniel Campos},
  title     = {What a Monitor Actually Does},
  year      = {2026},
  month     = {may},
  url       = {https://www.zipf.ai/blog/what-a-monitor-actually-does},
  note      = {Zipf AI Blog}
}